
Introduction
Space analysis is the study of orthodontic models, which is critical for orthodontic diagnosis and treatment planning. It measures the degree and severity of malocclusion in three dimensions, which cannot be interpreted by the direct visualisation of the patient's oral cavity, particularly the lingual occlusion.1 An accurate impression of patient dentition and the fabrication of a good quality plaster model are the prerequisites for dental model analysis. Recently, the advent of digital dental models and software such as, automation, has significantly reduced the burden of traditional model analysis. Also, digital models eliminate the need for extensive physical space required with plaster models. The digital model can also be used to perform virtual setup and serve as patient education tool. It also aids in easy communication between specialists. 2, 3
Dental malocclusion is caused mainly by a discrepancy between the arch length and tooth sizes. Moreover, to achieve an ideal overjet and overbite with functional occlusion, both the size of maxillary and mandibular dentition should be proportionate. 4 Therefore, a systematized and detailed space analysis will help the orthodontist in treatment planning. Furthermore, dental models aid in the assessment of arch symmetry as well as the inter-arch and intra-arch relationship of dentition. Many methods have been described in the literature to analyse mixed and permanent dentition models. The purpose of this article is to summarise the different model analyses used in the permanent dentition stage for diagnosis and treatment planning.
ABO Recommendation for Study Model Presentation
The American Board of Orthodontics (ABO) has recommended a few standards to be followed for the presentation of study models. Accordingly, the study models should be obtained by an accurate impression involving dentition and soft tissue extending enough to the sulcus. The anatomical portion consists of the impression of the dental arch and surrounding structures, while the artistic part is the plaster base supporting the anatomic portion. An ideal orthodontic model should have an anatomical portion and an artistic base in the ratio of 3:1. Models should be trimmed according to specifications and articulated in centric occlusion. The trimming and carving of the anatomical portion should be limited. The total height of a base, including the maxilla and mandibular arches, should be between 70 and 75mm. The height of the anatomical base of a model should be 13mm, and the length of corner segments should be 13-15mm. The angle between the posterior surface and lateral surface of the model should be 650 and 550 in the maxillary and mandibular models, respectively. According to ABO, models should be finished and polished with exact specifications with 50 tolerance in base angles. (Figure 1 )

Model analysis in Permanent Dentition
Pont’s analysis
In 1909 Pont presented a formula or index whereby the measurement of mesiodistal width of four maxillary incisors can be used to establish the width of the arch in the premolar and molar regions. 5, 6 He studied the French population and defined a constant ratio between tooth size and arch width that became identified as premolar and molar indices. His study concluded that the ratio was 0.64 in the molar region and 0.80 in the premolar region. It helps in determining dental arch expansion in the premolar and molar regions. The importance of this analysis lies in the fact that it is necessary to consider dental arch expansion at an early stage, so dentoskeletal and muscular adaptation is possible before the eruption of permanent dentition. The following parameters are required to calculate the index. (Figure 2a)
The sum of incisors (SI) is obtained by adding the mesiodistal width of the four maxillary incisors.
The measured premolar value is obtained by measuring the interpremolar width from the distal pit of the maxillary first premolar on either side.
The measured molar value is obtained by measuring the intermolar width measured from the mesial pit of the maxillary first permanent molar on either side.
The calculated premolar value is obtained using (SI/80) X 100.
The calculated molar value is obtained using (SI/64) X 100.
Linder Harth analysis
Linder-Harth analysis (1961) is similar to Pont’s analysis, which is used to diagnose maxillary arch constriction at the premolar and molar regions. In this analysis, Pont's formula was modified to determine the calculated premolar and molar values. The calculated premolar value is obtained using the formula (SI/85) X 100, and the calculated molar value is obtained using the formula (SI/65) X 100.7 The difference between the calculated and measured values denotes the magnitude of the transverse discrepancy.
Korkhaus analysis
Korkhaus analysis (1939) is used to analyse the anteroposterior discrepancies in the position of the maxillary incisor based on the anterior arch length. 8 Like Pont's analysis, the calculated maxillary anterior arch length also utilises the sum of mesiodistal widths of maxillary incisor teeth (SI) and is represented by the following formula (SI/160) X 100. The measured maxillary anterior arch length is obtained as the perpendicular distance from a point between two maxillary central incisors to the midpoint of the inter-premolar line. An increased distance indicates the proclination of the maxillary anterior teeth, while a decrease indicates retroclined upper anterior teeth. (Figure 2b)
Howe's analysis
Howe’s analysis was proposed by Ashley Howe (1947) which is based on the relationship of the tooth position with its apical base. 9 Howe believed that the crowding of the teeth is usually due to a lack of width at the apical base rather than the arch length. Accordingly, if the width of the apical base is narrow, it can result in the crowding of teeth. Howe's index is based on the relationship between the total mesiodistal width of all teeth till the maxillary first molar on both sides and arch width in the first premolar region. He concentrated more on the maxillary apical base than the mandible as, according to him, maxillary base was the greater factor for the development of malocclusion. The following parameters are required to calculate the index.
Premolar diameter (PMD) refers to the distance between the buccal cusp tips of the first maxillary premolars (arch width)
Premolar basal arch width (PMBAW) refers to the distance between the right and left canine fossae at the apical base
Total tooth material (TTM) refers to the sum of the mesiodistal width of the teeth from the first molar on one side to the first molar on the opposite side.
PMD% is calculated as PMD X 100 /TTM
PMBAW% is calculated as PMBAW X 100 /TTM
Inference of the analysis
If the PMBAW exceeds the PMD value, maxillary arch expansion is possible.
If the PMD exceeds the PMBAW value, maxillary expansion is not indicated. The space is gained either by extraction or space regaining by distalization.
To achieve a normal occlusion with a full complement of teeth, the basal arch width at the premolar region (PMBAW) should be 44% of the sum of the mesiodistal widths of all the teeth mesial to the second molar (TTM).
If PMBAW% is 37% or less, extraction treatment is indicated, and if the value is 37-44%, the case is borderline. If the value is more than 44%, non-extraction treatment is indicated.
Neff’s Anterior coefficient analysis
Any variations in maxillary and mandibular tooth size proportion can lead to problems achieving ideal occlusion and alignment. In 1949, Neff proposed that the ratio of anterior teeth size is mathematically related to overbite and proposed the “anterior coefficient". 10 The sum of the mesiodistal width ofmaxillary and mandibular anterior teeth is computed using a three-inch divider. The ideal ratio between the mandibular and maxillary sum is 1.22; this value is called the anterior coefficient. An ideal anterior coefficient with an overbite of 20% has been determined to be 1.20-1.22. Deviation from these values can lead to improper occlusion and overbite problems.
Carey’s analysis
Carey's analysis (1949) calculates the discrepancy between arch perimeter and total tooth material. 11 This analysis is performed in the mandibular arch on a plaster model, and when it is done in the maxillary arch, it is called arch perimeter analysis. A 0.20” brass wire is used to measure the arch length from the mesiobuccal line angle of the permanent first molar along the buccal cusp and incisal edges of the anterior, similarly continuing to the opposite side. In the case of proclined incisors, brass wire is passed through the cingulum region, and if retroclined, the wire is placed labial to the incisors. (Figure 2c) Total tooth material is measured as the sum of the mesiodistal width of all teeth mesial to the first molar. The required space is calculated as the difference between the total tooth material and the corresponding arch length. When the amount of tooth material exceeds the arch length, crowding may be present, and there is insufficient room for alignment. If the arch discrepancy is 0 – 2.5 mm, proximal stripping can be attempted; if the discrepancy is 2.5 – 5 mm and greater than 5mm, the second premolar and first premolar can be extracted, respectively.

Lundstrom segmental analysis
Lundstrom segmental analysis (1960) is used to perform the indirect assessment of the arch perimeter segmentally on both arches.12 The dental arch is divided into six straight line segments, including two teeth per segment, starting from the distal aspect of the permanent first molar till the contralateral permanent first molar. (Figure 2d) The mesiodistal width of all teeth till the permanent first molar is recorded on both sides of the arch. Individual tooth width of each segment is added (space required), and the available mesiodistal space separately for each segment is noted. Finally, the difference between the space required and the space available in each segment determines the positioning of teeth. The negative value indicates crowding.
Bolton analysis
The Bolton's tooth size ratio presents an ideal diagnostic tool to predict the treatment outcome and reduces the need for diagnostic setup. A proper tooth size proportion between the maxilla and mandibular arch will favour proper functional occlusion. Previously, an investigation on tooth size ratio was conducted by Black in 1902 and Neff in 1949. Later, Dr Wayne Bolton, in 1958, studied the Caucasian population with good occlusion. 13
Using the three-inch pointed needle dividers, the mesiodistal width of 12 maxillary teeth from the incisor to the first permanent molar on either side is measured. Then, the sum of the mesiodistal width of 12 mandibular teeth is measured Overall ratio is calcuated using the formula (sum of 12 mandibular teeth ÷ sum of 12 maxillary teeth) X 100. Similarly, the anterior ratio is calculated using the formula (sum of 6 mandibular anterior teeth ÷ sum of 6 maxillary anterior teeth) X 100. The normal values of the overall and anterior Bolton ratios were determined to be 91.3% and 77.2%, respectively. However, the study was done only in the caucasian population and patients with perfect Class I occlusion, which underestimated the ratio.
Inference of the analysis
Those with a different ratio than the normal range are considered a Bolton discrepancy. A standard deviation greater than 1.5 mm results in a significant discrepancy. An overall ratio greater than 91.3% suggests that the mandibular teeth material is in excess. An overall ratio of less than 91.3% ratio suggests the mandibular teeth material is deficient in comparison to the maxillary teeth material. The anterior analysis follows the same principle. The amount of total tooth material excess can be quantified by using the formula:
Maxillary tooth material excess = Sum of maxillary 12 – (Sum of mandibular 12 ÷ 91.3) X 100
Similarly, the overall mandibular tooth material excess or maxillary and mandibular anterior tooth material can be calculated.
Sanin and savara's analysis
Sanin and Savara, in 1971, conducted a study on 51 males and 50 females of North Western European ancestry and having permanent dentition to establish a standard for identifying and analysing tooth-size discrepancies. 14 They found a direct relationship between crown size and crowding with occlusal irregularities. Charts were developed that were organized into percentiles of 10s. The teeth in the percentiles up to 30 were considered small, those between 30 and 70 as average-sized, and greater than 70 as large teeth. These charts also revealed if maxillary and mandibular teeth are proportional to each other and can aid estimate the discrepancy (small, medium, large) and its magnitude. The main drawback of this analysis is that the percentiles are formulated for the American population and are not age-specific.
Peck and peck's analysis
Harvey Peck and Sheldon Peck (1972) presented an odontometric analysis for detecting and evaluating tooth shape deviations of the mandibular incisors. 15 This analysis is based on the fact that mandibular anterior teeth incisor crowding is one of the most common malocclusion due to genetic and environmental factors. In addition, the well-aligned mandibular incisors have unique dimensional features, such as having a greater faciolingual dimension and a smaller mesiodistal dimension. Therefore tooth shape is one of the determining factors for mandibular incisor crowding. The following formula is used to calculate the index.
Peck and peck index = (Mesiodistal crown diameter/ Faciolingual crown diameter) X 100
The average values for the mandibular central and lateral incisors are 88 to 92% and 90 to 95%, respectively. If the calculated value is greater, it denotes that the mesiodistal width is greater than the faciolingual width, suggesting the need for interproximal stripping.
Little irregularity index
Robert M Little (1975) developed an epidemiologic index to measure the crowding of the mandibular anterior region. 16 It is based on the fact that, for proper occlusion, the anatomic contact points of the mandibular anterior teeth must abut each other. Intercontact distances reflect all sorts of malocclusion and displacement in the mandibular. Therefore, it calculates the sum of mandibular anterior contact points measured parallel to the occlusal plane. The little index was explicitly developed for mandibular arches, but Mew et al. have demonstrated that it is also useful for maxillary arches. 17 The displacement in contact points of about 3mm is a minimum irregularity, 4-6mm denotes moderate irregularity, 7-9mm denotes severe irregularity and 10-20mm denotes very severe irregularity.
Total dentition space analysis
In 1978 Levern L Merrifield, a follower of Tweed’s philosophy devised a space analysis technique. 18 He believed that most of the space analyses were concerned about anterior teeth and its essential to consider the whole dentition. He also felt that the movement of teeth could neither create nor destroy available space. Total space analysis is divided into three parts, i.e. anterior, mid-arch and posterior. This analysis helps us identify the space discrepancy and diagnose it more accurately. The cranial facial analysis, when combined with the total dentition space analysis, comprises the Differential Diagnostic Analysis System.
Anterior denture analysis
The discrepancy is measured by the difference between total space available from canine to canine and mesiodistal measurements of six anterior teeth. The diagnostic facial triangle is also considered during the analysis. The mandibular incisors are repositioned according to the proposed FMIA, and the difference in angulation is multiplied by 0.8 to get the difference in millimetres. Next, the Merrifield Z angle is measured, and cephalometric correction is added to it. The Z angle should be 78±30 when FMIA is 680 and varies proportionately. It also considers soft tissue relations, where the thickness of the upper lip should be lesser than soft tissue chin thickness.
Mid-arch denture analysis
The available space is measured from the distal to mandibular canine to distal to the first molar on each side and added together. The required space is calculated by measuring the mesiodistal width of the bicuspid and the first molar on both sides. In addition, the flattening of the curve of Spee is also included in the required space. The difference between available and required space defines the mid-arch space discrepancy.
Posterior denture analysis
The required space is calculated by measuring the mesiodistal width of the second and third molars if they erupted. When the third molars are impacted, mesiodistal width is calculated in an intraoral periapical radiograph. The available space is calculated by measuring the distance from the first molars’ distal surface to the ramus’s anterior border. The best measurement method is a 5 x 7” lateral jaw x-ray, but a lateral cephalogram can also be used. The estimated increase in space is 2mm per year until 15 years in girls and 17 years in boys. Whereas in mature patients, its estimated length is measured till the anterior border of the ramus. The posterior excess space is used to alleviate anterior and mid-arch discrepancies. It is also vital to avoid discrepancies in the posterior arch region while attempting to correct the anterior and mid-arch discrepancies.
Royal london space analysis
The Royal London Space Analysis (2000) measures the required space to achieve treatment goals and quantifies the space implications of treatment mechanics. 19, 20 Space analysis helps us to determine the anticipated treatment plan, anchorage determination, and extraction choice, provide information to the patient and provide valid consent. It is done in two stages: first, the total space required for theSpace calculations in Royal London Space Analysis arches are calculated. (Table 1) Then the space creation, such as tooth reduction or enlargement, extraction, space opening for prosthetic replacement, mesiodistal molar movement and differential anteroposterior growth of the maxilla and mandible, are assessed. After calculating the space needed and space creation, the residual score should be zero in both arches. The advantages of this analysis are the consistency in treatment planning, and trainee orthodontists can understand the space requirements and plan treatment biomechanics efficiently.
Table 1
Space calculations in royal London space analysis
Digital methods to perform model analysis
Study models are reliable and popular forms of diagnostic records and they are used for model analysis and mounted on articulators to visualize CR-CO discrepancies. Although it has been used widely, the plaster study model has its limitations. The plaster models can break and wear off while handling it multiple times. Office storage is another major problem with the plaster models. An offsite storage facility can cost orthodontists, and transportation of fragile models is a difficult task. Communication with other specialists needs another set of models, and duplication of models is time-consuming and costly. Most of the challenges with plaster models are resolved by using digital models. Various automated systems have been developed to perform space analysis and other analyses using digital models. (Figure 3b.) The advantages include precision and less time consumption.21 Another method, a digital stereomicroscope, has been used for tooth measurements. It uses reflected light to provide two optical paths for each eye, resulting in a three-dimensional image view. With an accuracy of 0.1x 10⁻⁶, a stereomicroscope is a valid and reliable method for assessing teeth discrepancies. 22
Figure 3
a: Mesiodistal tooth width measurement in plaster model using a digital calliper; b: Mesiodistal tooth width measurement, intermolar and interpremolar distances in the digital model; c: Mesiodistal width of impacted canine in CBCT segmented 3D model; d: Mesiodistal tooth width measurement in an axial slice of CBCT (at the level of contact points of the teeth).
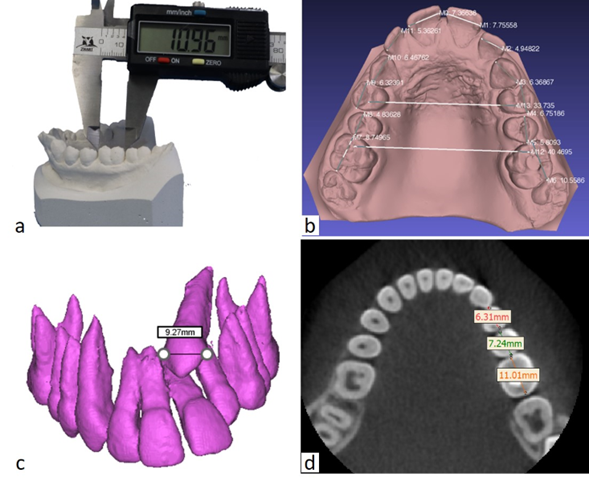
Conventional and digital models have only helped us analyze discrepancies in the coronal region. With the development of CBCT, imaging-based orthodontic diagnosis made significant strides. It gives us knowledge of three-dimensional structures and enables accurate diagnosis. In addition, the CBCT images can be used to measure tooth size discrepancies, root crowding and abnormalities, root resorption, teeth developmental stages, identify missing/supernumerary teeth, impacted tooth position and amount of bone present for orthodontic tooth movement. The measurement on the CBCT models is as quick as on digital models. The segmented teeth and volumetric images can be used to measure the tooth dimensions and recognize orthodontic tooth movement limits.23 (Figure 3c,d). However, CBCTs are not indicated routinely for the purpose of space analysis. It can be performed in patients with the CBCT indicated for other diagnostic purposes and when it is readily available.
Conclusion
The model analysis of permanent dentition should be performed meticulously so that different treatment options can be explored. The properly executed model analysis may avoid the need for diagnostic model setup in every case, help to plan the treatment mechanics, identify the potentially unstable tooth movements and decide the retention protocol. Apart from achieving an ideal occlusion, the dentition should be placed optimally according to the esthtetic zone of the face three-dimensionally. However, aesthetic needs and functional occlusion may sometimes conflict; therefore, the process of model analysis is directly linked with the treatment objectives. Currently, the use of 3D radiographs, digital models and automated model analysis has been explored. It has the potential to revolutionize the process of orthodontic diagnosis and treatment planning in the near future.