- Visibility 538 Views
- Downloads 41 Downloads
- Permissions
- DOI 10.18231/j.ijodr.2021.009
-
CrossMark

Abstract
Introduction: The relationship between the malocclusion and the facial form has been a focus for Orthodontists since the early 20th century. Cephalometrics can be utilized to describe, compare and classify the nature of orthodontic problems. Since well-established Indian ethnic norms are lacking, norms derived for Caucasian population are routinely used for investigations. Rajasthan is one of the largest state in India and Mewar is one of the major areas of it. With the increasing number of children of Rajasthan seeking professional treatment for malocclusion, it has become apparent that there is need to determine what constitutes a pleasing or normal face for the children of Rajasthan. A comprehensive and accurate diagnostic assessment of any orthodontic patient involves the comparison of the patient’s cephalometric findings with the norms of his or her ethnic groups or racial groups or subgroups.
Materials and Methods: This study was conducted on 100 lateral cephalographs which were selected from the records in the Department of Orthodontics and Dentofacial Orthopedics.
Results: According to results there was a higher FMPA in males than females in Western Rajasthan population. While observing the overall result no significant difference was observed in FMPA between male and female population of Western Rajasthan.
Conclusion: The present study was undertaken to develop cephalometric norms of Tweed’s diagnostic facial triangle for West Rajasthan population and to find out any variation from Caucasian standard. The result of the study indicated that separate norms should be considered for West Rajasthan males and females during diagnosis and treatment planning.
Introduction
The relationship between the malocclusion and the facial form has been a focus for Orthodontists since the early 20th century. Cephalometrics can be utilized to describe, compare and classify the nature of orthodontic problems. Different analyses and their corresponding norms have been formulated by various authors to interpret the diagnostic data that the lateral cephalogram provides. Among the investigators, the systematic approaches developed by Downs, Steiner, Ricketts and Tweed probably gained the widest acceptance. However, their norms were usually based on Caucasian samples only. Among the investigators, the systematic approaches developed by Downs, Steiner, Ricketts and Tweed probably gained the widest acceptance. However, their norms were usually based on Caucasian samples only. The cephalometric norms of different ethnic and racial groups established in various studies show that normal measurements for 1 group are not necessarily normal for another group; each racial group must be treated according to its own characteristics. A number of standards have been developed for various racial and ethnic groups. It is important to compare a patient’s cephalometric findings with the norms for his or her ethnic group for an accurate diagnostic evaluation, with the consideration of his or her treatment goals and needs. [1] Since well-established Indian ethnic norms are lacking, norms derived for Caucasian population are routinely used for investigations. As these norms show a great degree of variation when applied to different populations, it becomes necessary to establish the norms for every ethnic group. Indian population comprises of different ethnic groups and races. States in India are created on the basis of languages and not on ethnicity or racial origin.[2] Rajasthan is one of the largest state in India and Mewar is one of the major areas of it. With the increasing number of children of Rajasthan seeking professional treatment for malocclusion, it has become apparent that there is need to determine what constitutes a pleasing or normal face for the children of Rajasthan. A comprehensive and accurate diagnostic assessment of any orthodontic patient involves the comparison of the patient’s cephalometric findings with the norms of his or her ethnic groups or racial groups or subgroups. [3]
Materials and Methods
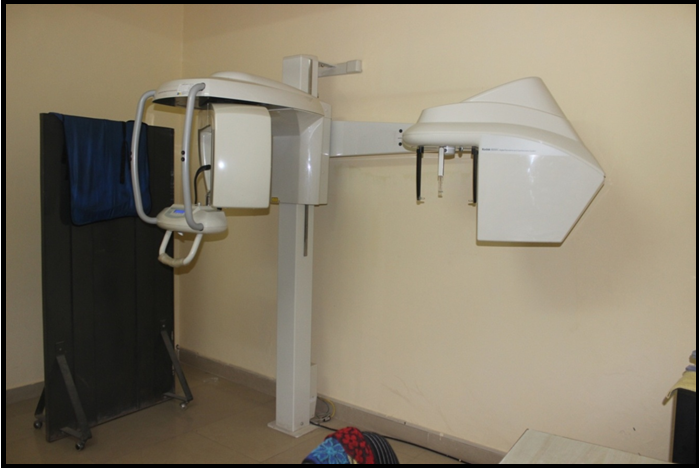
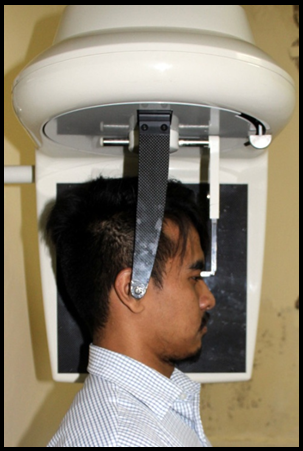
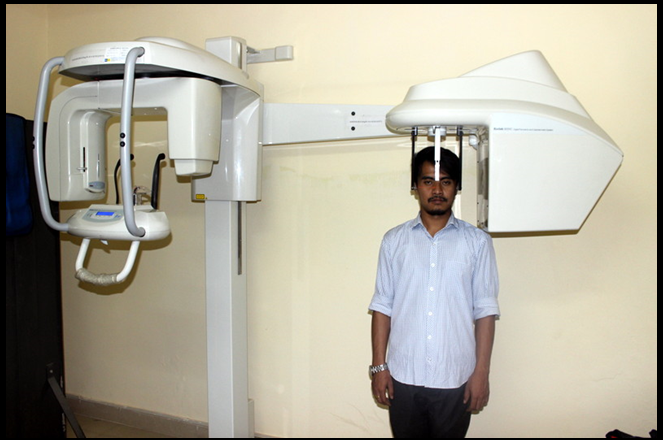
This study was conducted on 100 lateral cephalographs which were selected from the archives of the records in the Department of Orthodontics and Dentofacial Orthopedics at Vyas Dental College and Hospital, Jodhpur.Radiographs had been taken in a standardized manner using KODAK 8000 C Digital Panoramic Cephalometric Systems ([Figure 1]) to capture and store the digital images. The head of the patient was positioned in the cephalostat and the natural head posture was obtained by making the patient look into a mirror, which was kept at eye level. The position was then stabilized with the help of ear rods, which were lightly placed in the ear. The distance from the tube to the patient was standardized at 5 feet. All the radiographs were exposed at 75 kVp, 15 mAm and 2.5 seconds exposure time. Lateral cephalographs were taken in centric occlusion with lips in relaxed position ([Figure 2], [Figure 3]).
Inclusion criteria
Normal Overjet and Overbite.
Harmonious Profile.
No history of previous Orthodontic treatment.
West Rajasthani ethnicity.
No congenital or acquired malformations of skeletal or dental origin.
Exclusion criteria
Previous orthodontic treatment.
Congenital or acquired malformations of skeletal or dental origin.
More than 7mm of overjet and more than 6mm of overbite.
Population other than west Rajasthan.
For the purpose of this study, following materials were used:
High quality lateral cephalographs of all patients
0.003 inch acetate tracing paper.
Cephalometric tracing table
0.3 micro lead pencil
Mathematical drawing instruments including metallic scale, square sets, protractor etc.
Tracing of the cephalometric radiographs were made by hand using a sharp 3H pencil on acetate tracing paper in a dark room using X-ray viewer. The important hard and soft tissue structures were then marked on the cephalogram. Various references points, planes and angles were drawn and recorded. ([Table 1], [Table 2]). After the tracing of the cephalometric points, different cephalometric analyses were performed for each subject. ([Table 3], [Table 4]).
Cephalometric analysis
For each subject the following cephalometric parameters will be measured:
Angular measurements
Frankfort mandibular plane angle (FH-MP): angle formed by extending mandibular plane to Frankfort horizontal plane.
Incisor mandibular plane angle (IMPA): Angle formed by extending lower incisor long axis to the mandibular plane.
Frankfort mandibular incisor angle (FMIA): Angle formed by extending mandibular incisor long axis to the Frankfort horizontal plane.
Linear measurements
Frankfort horizontal plane: A plane connecting a point 4.5 mm above the geometric centre of the ear rod and an orbitale point midway between the left and right lower border of the orbit.
Mandibular plane: A plane tangent to the lower border of mandible which connects with the menton anteriorly and posteriorly it bisects the distance between the right and left lower borders of the mandible in the region of the gonial angle.
Mandibular incisor long axis: A plane made by extending the long axis of the mandibular central incisor downward to the mandibular plane and upward to the Frankfort plane.
|
1. |
S (sella) |
The midpoint of hypophyseal fossa. It is a constructed point in the median plane. |
|
2. |
N (nasion) |
The most anterior point of fronto-nasal suture in the median plane. |
|
3. |
Point A |
The deepest midline point on the maxilla between anterior nasal spine and prosthion. |
|
4. |
Point B |
The deepest midline point on the mandible between pogonion and the crest of mandibular alveolar process. |
|
5. |
Po (porion) |
Superior point on the external auditory meatus. |
|
6. |
Or (orbitale) |
Lowest point in the inferior margin of the orbit. |
|
7. |
Go (gonion) |
Constructed point of intersection of the ramus plane and the mandibular plane |
|
8. |
Me (menton) |
Most inferior midline point on the mandibular symphysis. |
|
9. |
Ar (Articulare) |
Junction of posterior border of ramus and inferior part of basilar part of occipital bone. |
|
1. |
Frankfort Horizontal plane |
From point orbitale to the superior most point on the external auditory meatus (porion). |
|
2. |
Mandibular plane |
A line that is tangent to the inferior border of the mandible. |
|
3. |
Mandibular incisor long axis |
A plane made by extending the long axis of the mandibular central incisor downward to the mandibular plane and upward to the Frankfort plane. |
|
1. |
FH-MP |
Angle between Frankfort horizontal plane and the mandibular plane. |
|
2. |
IMPA |
Angle formed by extending lower incisor long axis to the mandibular plane. |
|
3. |
FMIA |
Angle formed by extending mandibular incisor long axis to the Frankfort horizontal plane. |
Results
Software- SPSS version 20
Statistical tests: The Normality tests Kolmogorov-Smirnov and Shapiro-Wilks tests show that the data is normally distributed. We conducted Parametric tests. Independent- t test was done to compare the Frankfort mandibular plane angle in two groups, keeping value of significance p<0.05. To evaluate tracing and measurement error, the lateral cephalograms of 25 subjects were selected randomly and retraced, to evaluate the intra-operator reliability and reproducibility of landmarks, reference planes and measurements for each of the groups evaluated. To evaluate tracing and measurement error, the lateral cephalograms of 15 subjects were selected randomly and retraced, to evaluate the inter-operator reliability and reproducibility of landmarks, reference planes and measurements for each of the groups evaluated. The one way analysis of variance (ANOVA), followed by post-hoc Tukey’s test were performed to determine whether there were statistically significant differences between mean values of each analysis in all the groups.
Independent- t test: is used to compare the difference between the mean of two independent samples.
Results
|
S No. |
|
Characteristics |
N (%) |
|
1. |
Gender |
Males |
50 |
|
2. |
Females |
50 |
|
Gender |
Angle |
Mean |
Std. Deviation |
|
Male |
FMPA |
26.50 |
6.54 |
|
IMPA |
97.70 |
8.05 |
|
|
FMIA |
55.80 |
9.70 |
|
|
Female |
FMPA |
26.24 |
4.85 |
|
IMPA |
94.56 |
8.54 |
|
|
FMIA |
59.08 |
9.36 |
|
Parameter |
Mean Difference |
t |
p value |
|
FMPA |
0.26 |
0.22 |
0.035 |
|
IMPA |
3.14 |
1.89 |
0.472 |
|
FMIA |
-3.28 |
-1.72 |
0.954 |
|
Degree |
Males n(%) |
Females n(%) |
|
<20 |
8(16.0) |
6(12.0) |
|
20-24.9 |
12(24.0) |
11(22.0) |
|
25-29.9 |
14(28.0) |
19(38.0) |
|
30-34.9 |
11(22.0) |
10(20.0) |
|
≥35 |
5(10.0) |
4(8.0) |
|
Total |
50 (100.0) |
50 (100.0) |
|
Degree |
Males n(%) |
Females n(%) |
|
<80 |
2(4.0) |
5(10.0) |
|
80-84.9 |
0(0.0) |
1(2.0) |
|
85-89.9 |
4(8.0) |
7(14.0) |
|
90-94.9 |
9(18.0) |
12(24.0) |
|
95-99.9 |
14(28.0) |
8(16.0) |
|
100-104.9 |
13(26.0) |
12(24.0) |
|
≥105 |
8(16.0) |
5(10.0) |
|
Total |
50(100.0) |
50(100.0) |
Discussion
According to results there was a higher FMPA in males than females in Western Rajasthan population.
While observing the overall result no significant difference was observed in FMPA between male and female population of Western Rajasthan.
The relationship between the malocclusion and the facial form has been a focus for Orthodontists since the early 20th century. Cephalometrics can be utilized to describe, compare and classify the nature of orthodontic problems. Different analyses and their corresponding norms have been formulated by various authors to interpret the diagnostic data provided by the lateral cephalogram. Among the investigators, the systematic approaches developed by Downs, Steiner, Ricketts and Tweed probably gained the widest acceptance. However, their norms were usually based on Caucasian samples only.
Many cephalometric analyses have been developed to establish norms for ideal facial proportions and occlusion, presenting average measurements of skeletal or dental patterns and their ranges. Since well-established Indian ethnic norms are lacking, norms derived for Caucasian population are routinely used for investigations. As these norms show a great degree of variation when applied to different populations, it becomes necessary to establish the norms for every ethnic group. Indian population comprises of different ethnic groups and races. States in India are created on the basis of languages and not on ethnicity or racial origin.
Cephalometric studies on non-Caucasians have indicated that there are measurable skeletal and dental differences when compared to Caucasians. Numerous studies have shown variation between and within the different populations. It has been suggested that factors such as age, sex and racial origin, as well as facial type, contribute to this variations.[4]
The cephalometric norms of different ethnic and racial groups established in various studies show that normal measurements for 1 group are not necessarily normal for another group; each racial group must be treated according to its own characteristics. A number of standards have been developed for various racial and ethnic groups. It is important to compare a patient’s cephalometric findings with the norms for his or her ethnic group for an accurate diagnostic evaluation with the consideration of his or her treatment goals and needs.[1]
This study was carried out to determine cephalometric norms for West Rajasthan between the age group of 12 and 22 years. The ranges of most of the dimensions of the present study were significantly different than those obtained by Tweed, although all selected individuals had a pleasant appearance and good facial harmony.
The improvement of facial esthetics has rapidly become one of the desirable objectives of orthodontic treatment and the concept of normal has become indispensable to an orthodontist. The term normal was defined by Tweed as “The balance and harmony of proportions considered by the majority of us as most pleasing in the human face.” However, since soft tissue, dental and skeletal structures exhibit different pattern for different races, it has become relevant to define norms for various ethnic groups of population for successful diagnosis and treatment planning. India is a land of diversified race of people. Hence, many research workers in India have initiated to undertake racial studies. Sidhu (1970), Ashima Valiathan (1976), Nanda (1969), Kapoor D. N., Chandranee N. J. et al. and many more have studied various racial groups and showed that the skeletal, dental, and soft tissue measurements vary significantly from one racial group to other.
This study was conducted on 100 lateral cephalographs which were selected from the archives of the records in the Department of Orthodontics and Dentofacial Orthopedics at Vyas Dental College and Hospital, Jodhpur.
Radiographs had been taken in a standardized manner using KODAK 8000 C Digital Panoramic Cephalometric System to capture and store the digital images. The head of the patient was positioned in the cephalostat and the natural head posture was obtained by making the patient look into a mirror, which was kept at eye level. The position was then stabilized with the help of ear rods, which were lightly placed in the ear. The distance from the tube to the patient was standardized at 5 feet. All the radiographs were exposed at 75 kVp, 15 mAm and 2.5 seconds exposure time. Lateral cephalographs were taken in centric occlusion with lips in relaxed position which was in accordance with the studies reported by Kumari L, Das A (2017). [5]
Results revealed that there was a higher FMPA in males than females in Western Rajasthan population. The mean Frankfort mandibular plane angle for males was 26.50 and for females were 26.24. The results show that Frankfort mandibular plane angle among males was higher than females.
The results were statistically significant (p<0.05). While observing the overall result no significant difference was observed in FMPA between male and female population of Western Rajasthan ([Table 2]).
Result of this study were also in accordance with the study reported by Ajayi EO (2005) conducted a study to evaluate and compare the FMPA in Nigerian Igbo boys and girls. It was concluded that there was a higher FMPA in Nigerian Igbo boys (26.14) than girls (25.99). [1]
Result of this study was also in accordance with the study reported by Abu-Tayyem HM et al (2011) conducted a study to evaluate and compare the FMPA in Emirates males and females. It was concluded that there was a higher FMPA in Emirates males (25.44) than females (23.17).[6]
Result of this study were also in accordance with the study reported by Rizvi HM et al (2017) conducted a study to evaluate and compare the FMPA in Bangladeshi young males and females. It was concluded that there was a higher Frankfort Mandibular Plane Angle in Bangladeshi young males (24.87) than Bangladeshi young females (24.17).
Result of this study were also in accordance with the study reported by Alam M et al (2013)[9] conducted a study to evaluate and compare the FMPA in Bangladeshi young males and females. It was concluded that Bangladeshi females were found to have significantly smaller FMA (26.14) than Bangladeshi males (27.24).
Result of this study were also in accordance with the study reported by Hasan MN et al (2014) conducted a study to evaluate and compare the FMPA in Bangladeshi young adults. It was concluded that Bangladeshi females were found to have significantly smaller FMA (24.6) than Bangladeshi males (26.2).
Result of this study were not in accordance with the study reported by Atit MB et al (2013)conducted the study of males and females of Maratha ethnic origin. It was concluded that there was a significantly smaller FMA in Maratha males (20.8) than females (23.9).[2]
Most cephalometric analyses are designed for orthodontic diagnosis and treatment planning. As well-established norms for specific ethnic groups are lacking, one had to rely on Caucasian norms for the assessment of orthodontic patient. This seems to be logically inappropriate because any two different population groups have several dissimilarities in their dentofacial structures, as is evident from the present study.
Conclusions
The present study was undertaken to develop cephalometric norms of Tweed’s diagnostic facial triangle for West Rajasthan population and to find out any variation from Caucasian standard. The result of the study indicated that separate norms should be considered for West Rajasthan males and females during diagnosis and treatment planning. All the parameters in the study showed statistically significant difference Average FMA of 25.84° in West Rajasthan participants indicated similar orientation of mandible to Frankfort horizontal plane in West Rajasthan participants as in Caucasian population. The difference found in the present study as compared to the standard Caucasian population may be due to racial variations. The present study highlights the fact that the excellence of facial pattern is peculiar to its racial group and such variations are of relative significance when planning out treatment objectives. The present study was done with a limited number of West Rajasthan samples. For standardization of result, further extensive study is necessary with greater number of samples and meticulous sample selection.
Source of Funding
No financial support was received for the work within this manuscript.
Conflict of Interests
The author declares that they do not have any conflict of interests
References
- Ajayi EO. Cephalometric norms of Nigerian children. American journal of orthodontics and Dentofacial Orthopedics. 2005;128(5):653-659. [Google Scholar]
- Rizvi HM, Hossain MZ. Cephalometric Profile of Bangladeshis: Tweed’s Analysis. APOS Trends in Orthodontics. 2017;7:130-134. [Google Scholar] [Crossref]
- Alam MK, Basri R, Purmal K, Sikder MA, Saifuddin M, Iida J. Craniofacial morphology of Bangladeshi adult using Tweed’s and Wit’s analysis. International Medical Journal. 2013;20(2):197-200. [Google Scholar]
- Vaid S, Verma S, Negi K, Kaundal J, Sood S, Malhotra A. Determination of downs hard tissue cephalometric norms for Himachali Mongoloid tribes. Orthodontic Waves. 2019;78:11-17. [Google Scholar] [Crossref]
- Hashim HA, Kh A. Soft tissue relation and tweed triangle in a Saudi sample. Pak Oral Dent J. 2002;22:127-159. [Google Scholar]
- Kumari L, Das A. Determination of Tweed's cephalometric norms in Bengali population. European Journal of Dentistry. 2017;11:305-310. [Google Scholar] [Crossref]